Turning the Tide on Table Design
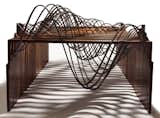
Segal used data collected over one month, in the spring of 2006, off the coast of San Francisco. "I used tidal graphs as the data subject because I am most interested in processes of nature," Segal explains, "and because it is difficult to see the connections, relations, and patterns of tidal flows from simply looking at a tidal graph."
Segal converted the graphs into vectors and translated the data into bent metal, placing it within the familiar context and human scale of furniture. The wave-like steel runs both above and below the surface of the table, with the floor below signifying sea level. "The forms modeled from the data not only reveal a dynamic pattern," she says, "they facilitate a new way of experiencing information by enabling a physical interaction of tidal patterns with the body." She hopes to grow this body of work in the future by continuing to translate other forms of data-based information into beautiful, functional forms.
All photos copyright, Adrien Segal
Published
Last Updated
Get the Dwell Newsletter
Be the first to see our latest home tours, design news, and more.